⚡ A powerful & easy to use 100% Kotlin chart library for Android ⚡
It comes with library view based chartLib and composeable chartLibCompose
During the full Kotlin conversion,
- 4.0 🛑 package name changed to
info.appdev.charting - 4.0 🛑
MPPointFin renamed toPointF - 4.0 🛑
MPPointDin renamed toPointD - 4.1 🛑 methods like
setSomethingEnabled(true)are now properties likeisSomething = true - 5.0 🛑 Remove legacy package name
- 5.1 🛑
Entryis now anEntryFloat, btw, there is now aEntryDoubleas well - 5.1 🛑
BarEntryis now anBarEntryFloat, btw, there is now aBarEntryDoubleas well - 5.1 🛑
BubbleEntryis now anBubbleEntryFloat - 5.1 🛑
PieEntryis now anPieEntryFloat - 5.1 🛑
RadarEntryis now anRadarEntryFloat - 5.1 🛑
CandleEntryis now anCandleEntryFloat
Issues are ignored, but pull requests are not. If you need to get something done, submit a PR!
repositories {
    maven { url = uri("https://jitpack.io") }
}

dependencies {
    implementation("com.github.AppDevNext.AndroidChart:chartLib:VERSION")
    // or for compose
    implementation("com.github.AppDevNext.AndroidChart:chartLibCompose:VERSION")
}Currently only from Maven Central snapshot staging is provided
repositories {
    maven { url 'https://central.sonatype.com/api/v1/publisher/deployments/download/' }
}

dependencies {
    implementation 'info.mxtracks:chart:${latestVersion}-SNAPSHOT'
}
LineChart (with legend, simple design)
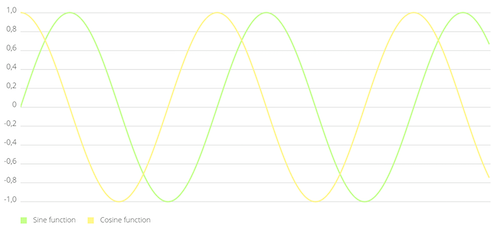
LineChart (with legend, simple design)
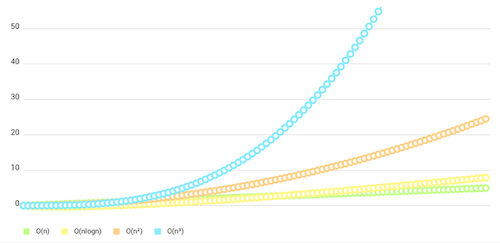
LineChart (cubic lines)

LineChart (gradient fill)

BarChart (with legend, simple design)

BarChart (grouped DataSets)

Horizontal-BarChart

Combined-Chart (bar- and linechart in this case)

PieChart (with selection, ...)

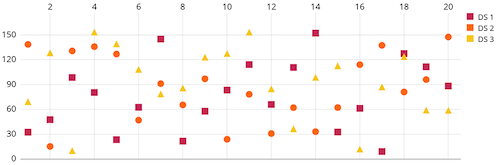
ScatterChart (with squares, triangles, circles, ... and more)
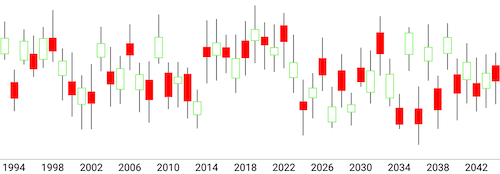
CandleStickChart (for financial data)
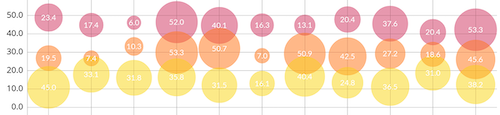
BubbleChart (area covered by bubbles indicates the yValue)
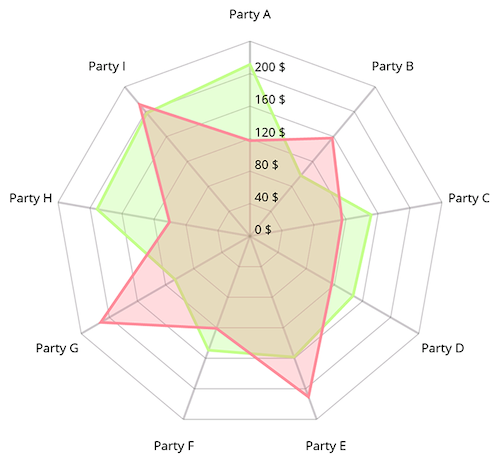
RadarChart (spider web chart)