ENH: plot flight center-of-pressure evolution (#954) - #1130
Conversation


|
we need to see one or two examples of the new plot before merging it please |

Codecov Report✅ All modified and coverable lines are covered by tests. Additional details and impacted files@@ Coverage Diff @@
## develop #1130 +/- ##
===========================================
+ Coverage 82.18% 90.56% +8.38%
===========================================
Files 122 131 +9
Lines 16355 17554 +1199
===========================================
+ Hits 13441 15898 +2457
+ Misses 2914 1656 -1258 ☔ View full report in Codecov by Harness. 🚀 New features to boost your workflow:
|

|
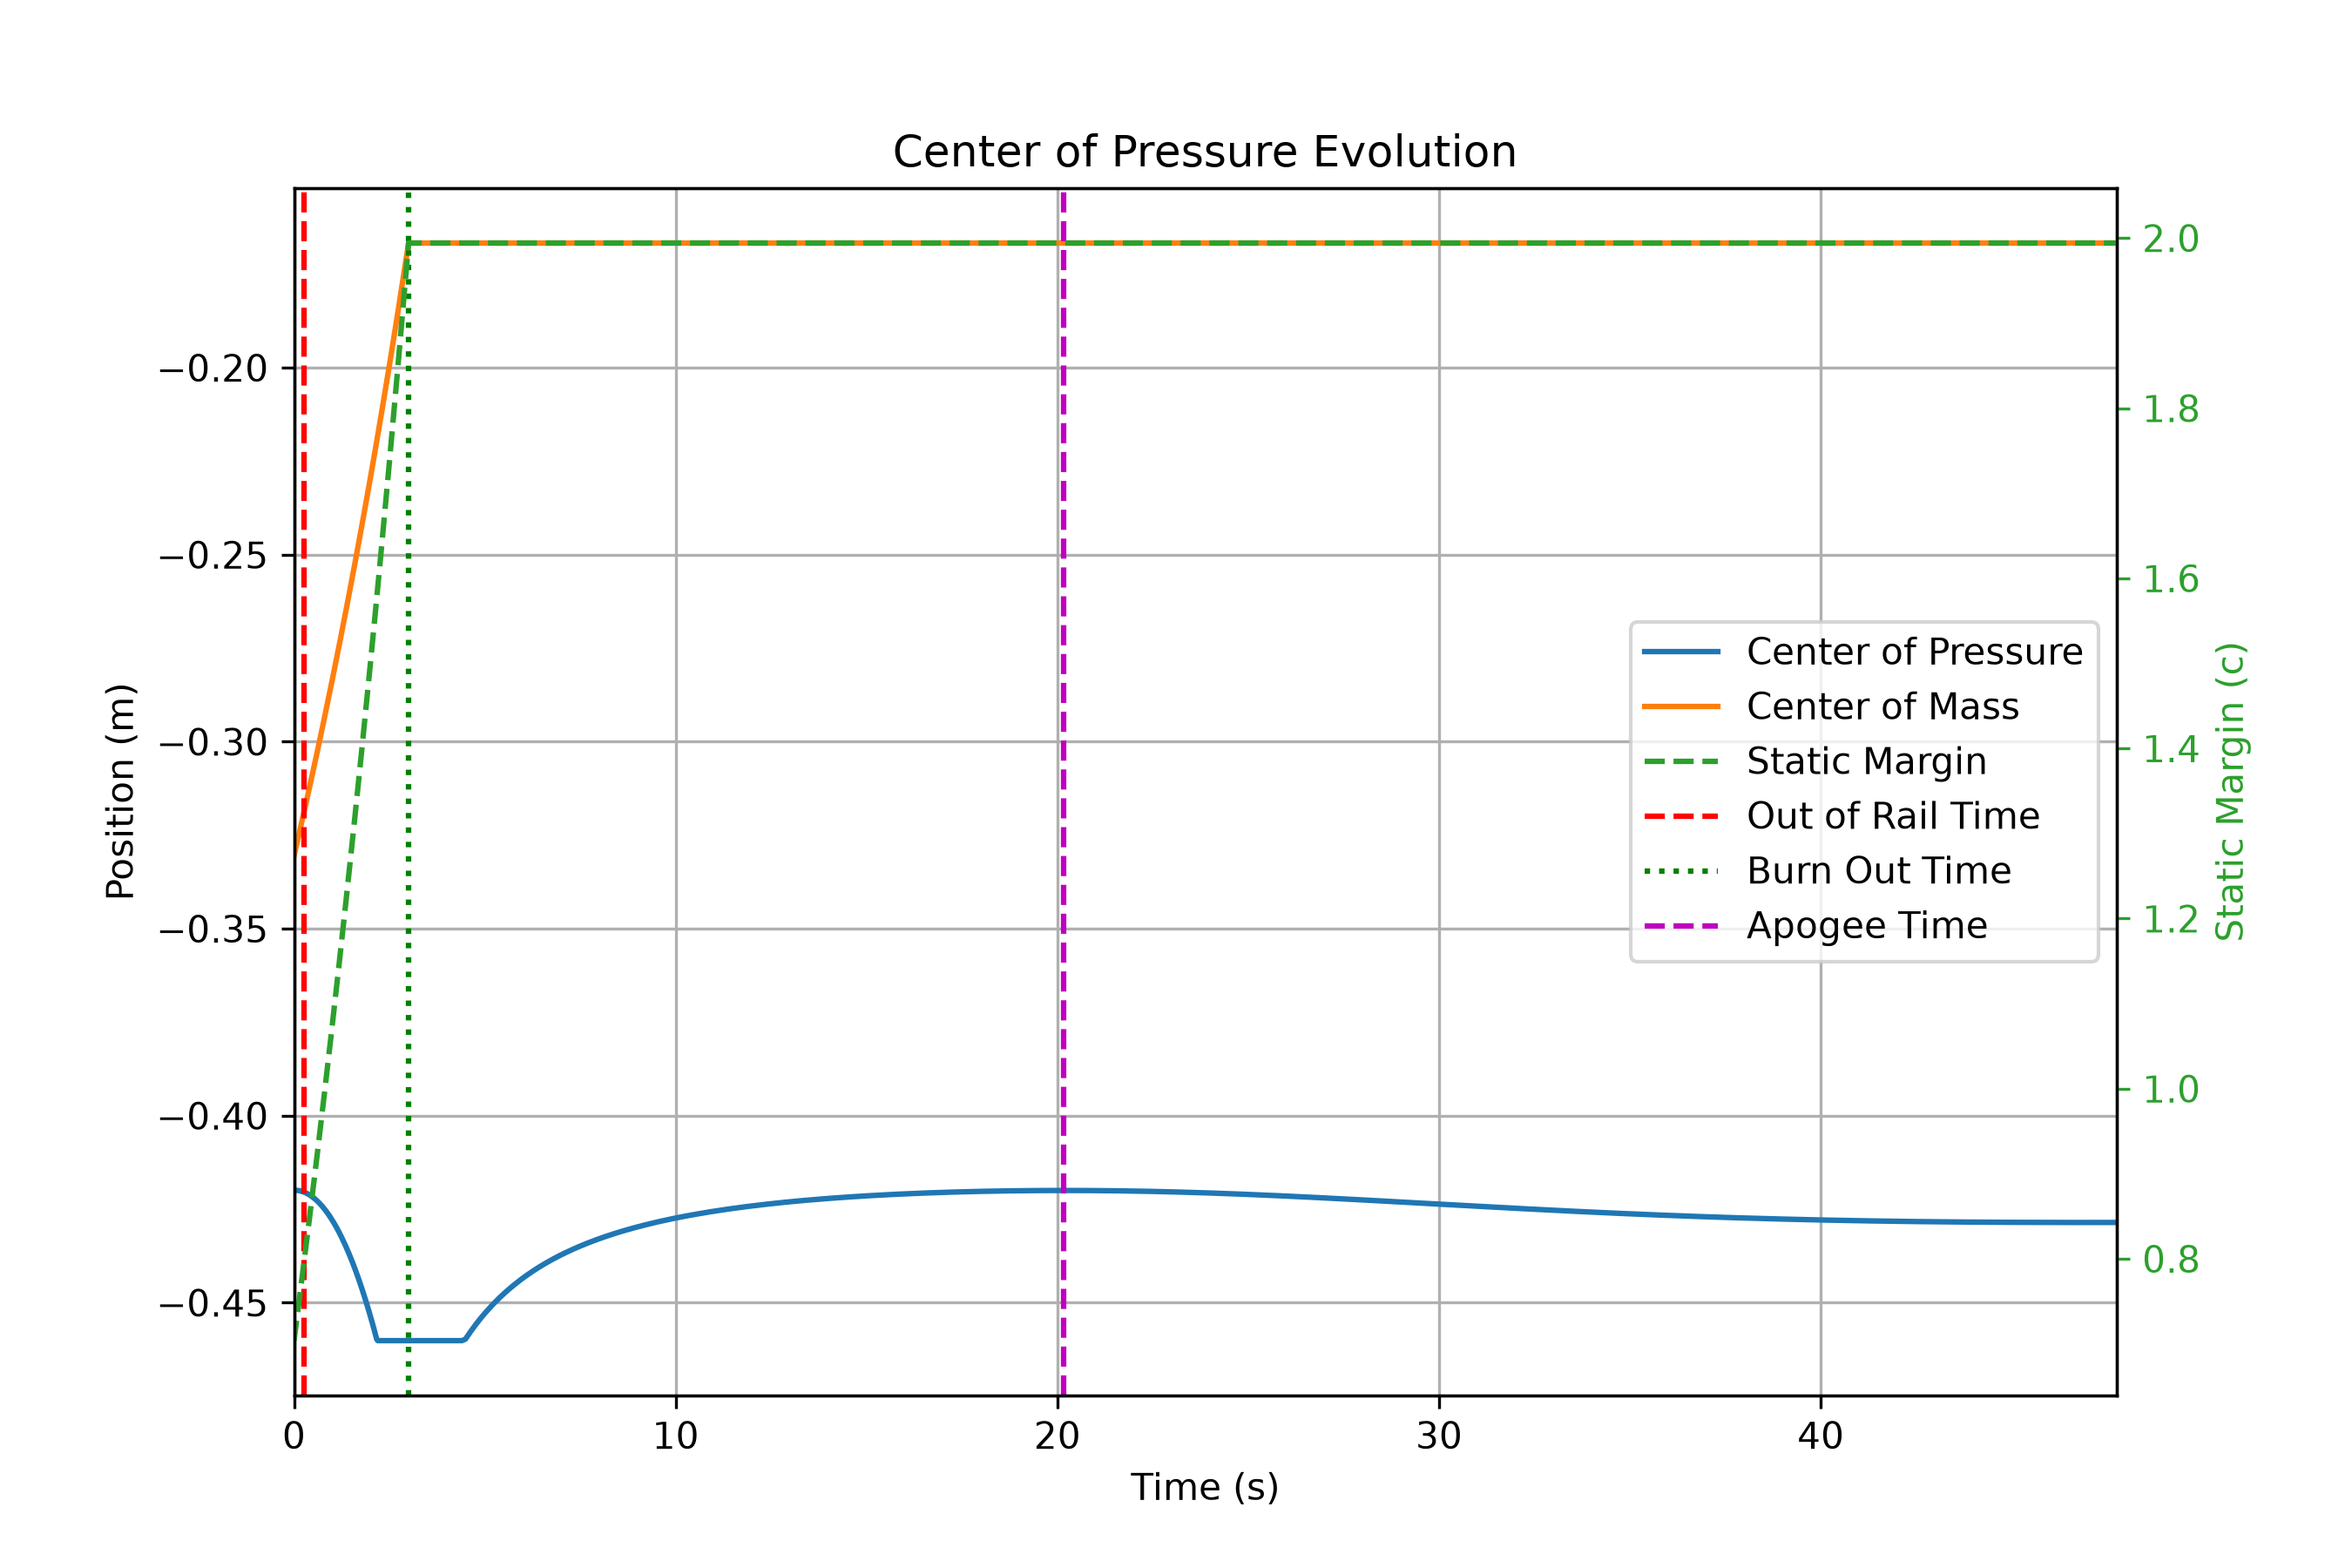
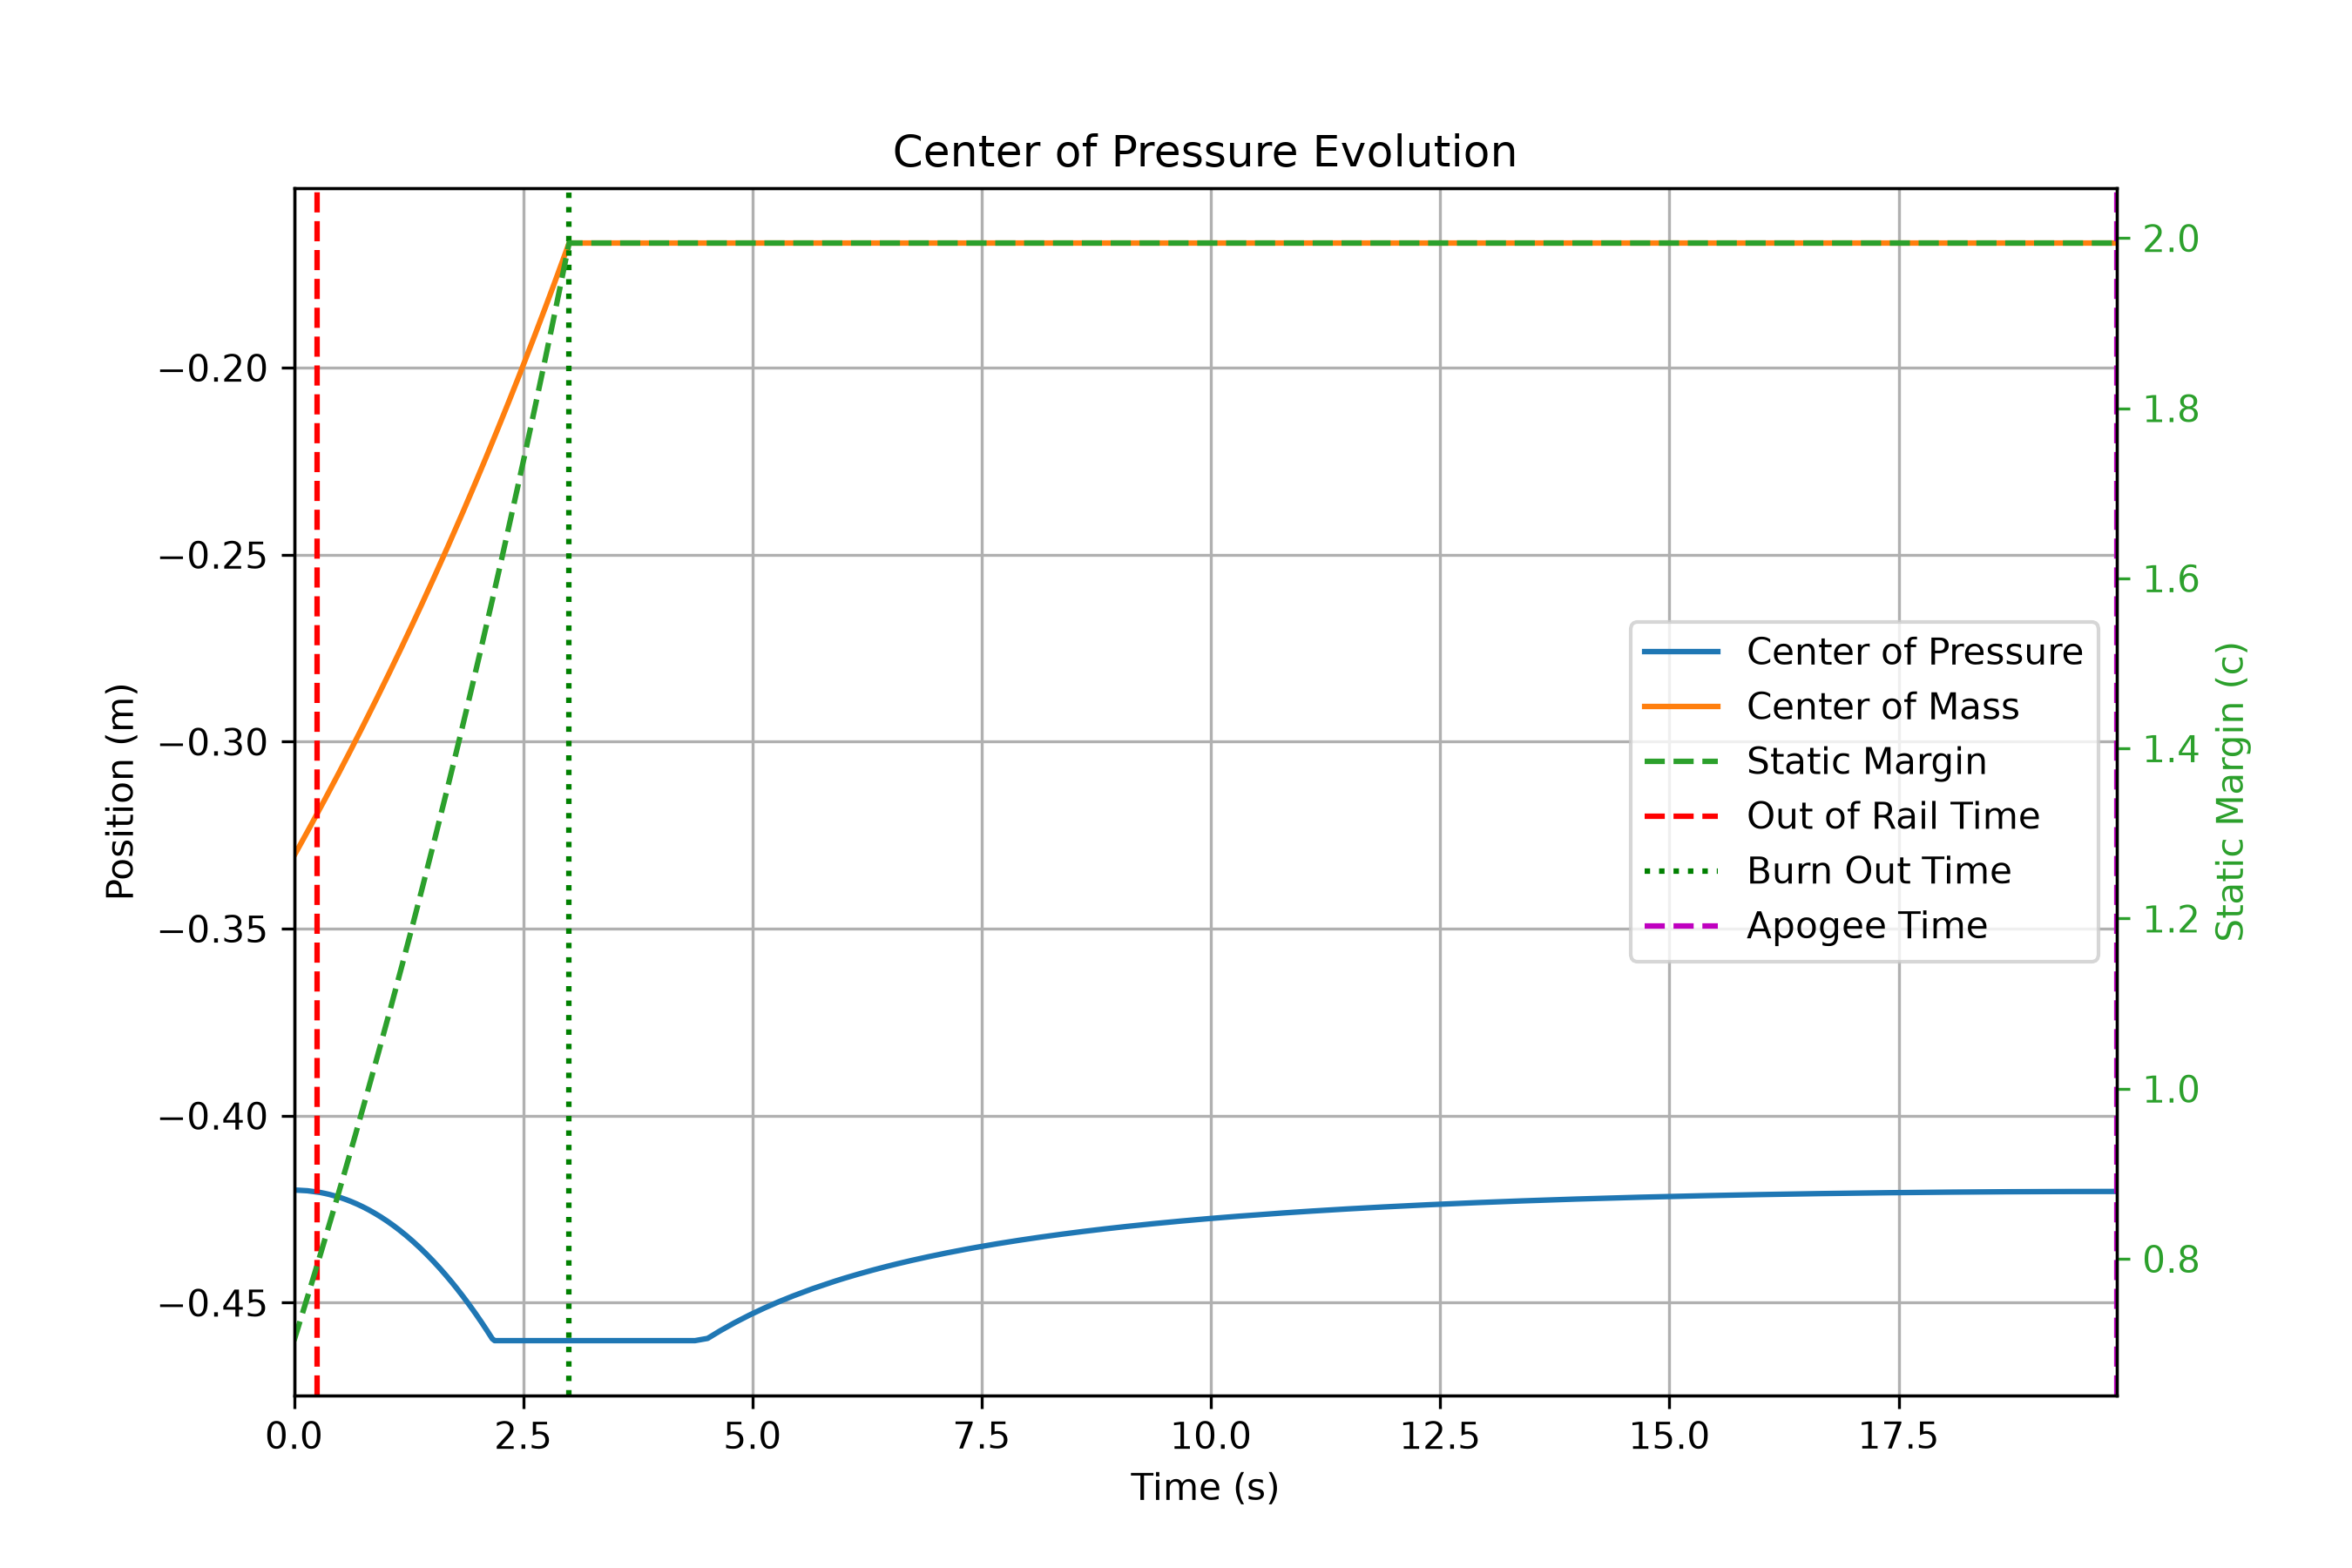
@Gui-FernandesBR here are two examples from this branch:
Both generated with |
|
the example plots don't really make sense |
|
Following up on my "the example plots don't really make sense" comment — I found why, and it is not the plotting code.
self.static_margin.set_discrete(lower=0, upper=self.motor.burn_out_time, samples=200)With For a flight-long quantity, use Two other notes:
|
 Gui-FernandesBR
left a comment
Gui-FernandesBR
left a comment
Gui-FernandesBR
left a comment
There was a problem hiding this comment.
no need to commit docs/static/pr_examples/cp_evolution_calisto_like.png file


These two PNGs were committed only to illustrate the plot in the pull
request description. Nothing in the docs or the code references them, so
they added ~345 kB of binaries to the tree for no reader.

Co-Authored-By: Claude Opus 5 (1M context) <noreply@anthropic.com>


2 participants


Summary
Flight.plots.center_of_pressure()to plot CP position vs time, evaluated at the flight Mach number at each stepFlight.plots.all()and cover show/save paths in unit testsFixes #954
Test plan
PYTEST_DISABLE_PLUGIN_AUTOLOAD=1 MPLBACKEND=Agg python -m pytest tests/unit/test_plots.py::test_flight_center_of_pressure_plot -qflight.plots.center_of_pressure()on a Calisto flight shows CP/CM/static-margin curves through first event time